Once again, we take a detour from our usual posts to display some of the educational artwork we’ve been developing …
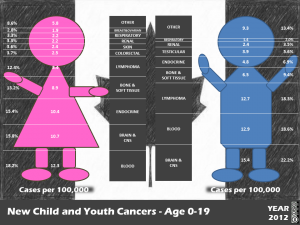
People always told me that leukemia was the most common type of cancer in children, but I had never actually looked it up myself. These data are taken from a Canadian government database called CANSIM. I used it to compile data on all documented cancers in Canada going back 20 years. At the time I made this figure, 2012 was the most recent year data was available for.
The data were downloaded from Table 103-0550 which lists all new primary cancers reported in Canada annually. I figured the age of 19 delineated childhood from adulthood, which could be debated, but nevertheless here we are. The graphic includes Canada-wide data divided by sex. Indeed, blood cancers make up the greatest proportion of the cancer burden in girls at 18.2% and 12.3 cases per 100,000. In boys however, it was brain and CNS cancers that made up the largest percentage at 22.2% (or 15.4 cases per 100,000). Blood cancers were second in boys at 18.6% (or 12.9 cases per 100,000). Other important cancer types were bone and soft tissue cancers, lymphomas and endocrine cancers.
It’s probably a surprise to no one that breast and prostate cancers make up the lion’s share of cancers in adult females and males respectively. What did surprise me though was the proportion of breast cancer compared to all other cancers. Fully 1/3 of all cancers in adult females are breast cancer accounting for 793 new cases per 100,000 people. Adding in uterine and cervical cancer you get ~45% of all adult female cancers falling into one of those categories. In men, the situation is a bit more diverse with prostate, colorectal and lung cancers accounting for about 43% of all male cancers.

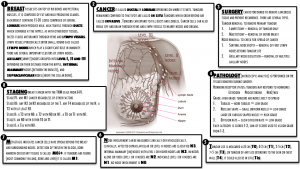
Breast Cancer Education